The Perfect Plate – February 2024
Every month, we’ll provide updates on the latest trends in the restaurant industry. We’ll include financial insights, charts, and public market comps.
If you are a hospitality investor or interested in learning more about investing in restaurants & hospitality – subscribe to access private offerings from our select clients.
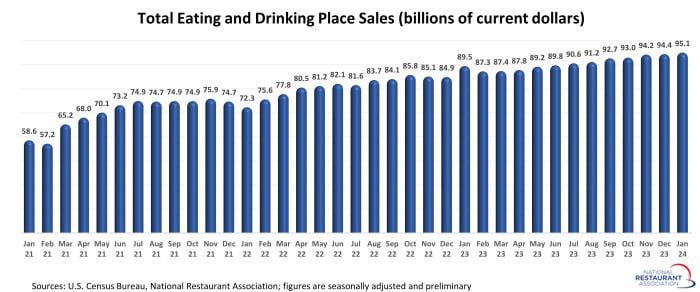
A positive start to 2024
Restaurant sales trended higher in inflation-adjusted terms during the last several months, as sales growth outpaced increases in menu prices. After adjusting for menu price inflation, eating, and drinking place sales were up 4.3% during the last 11 months. [National Restaurant Association]
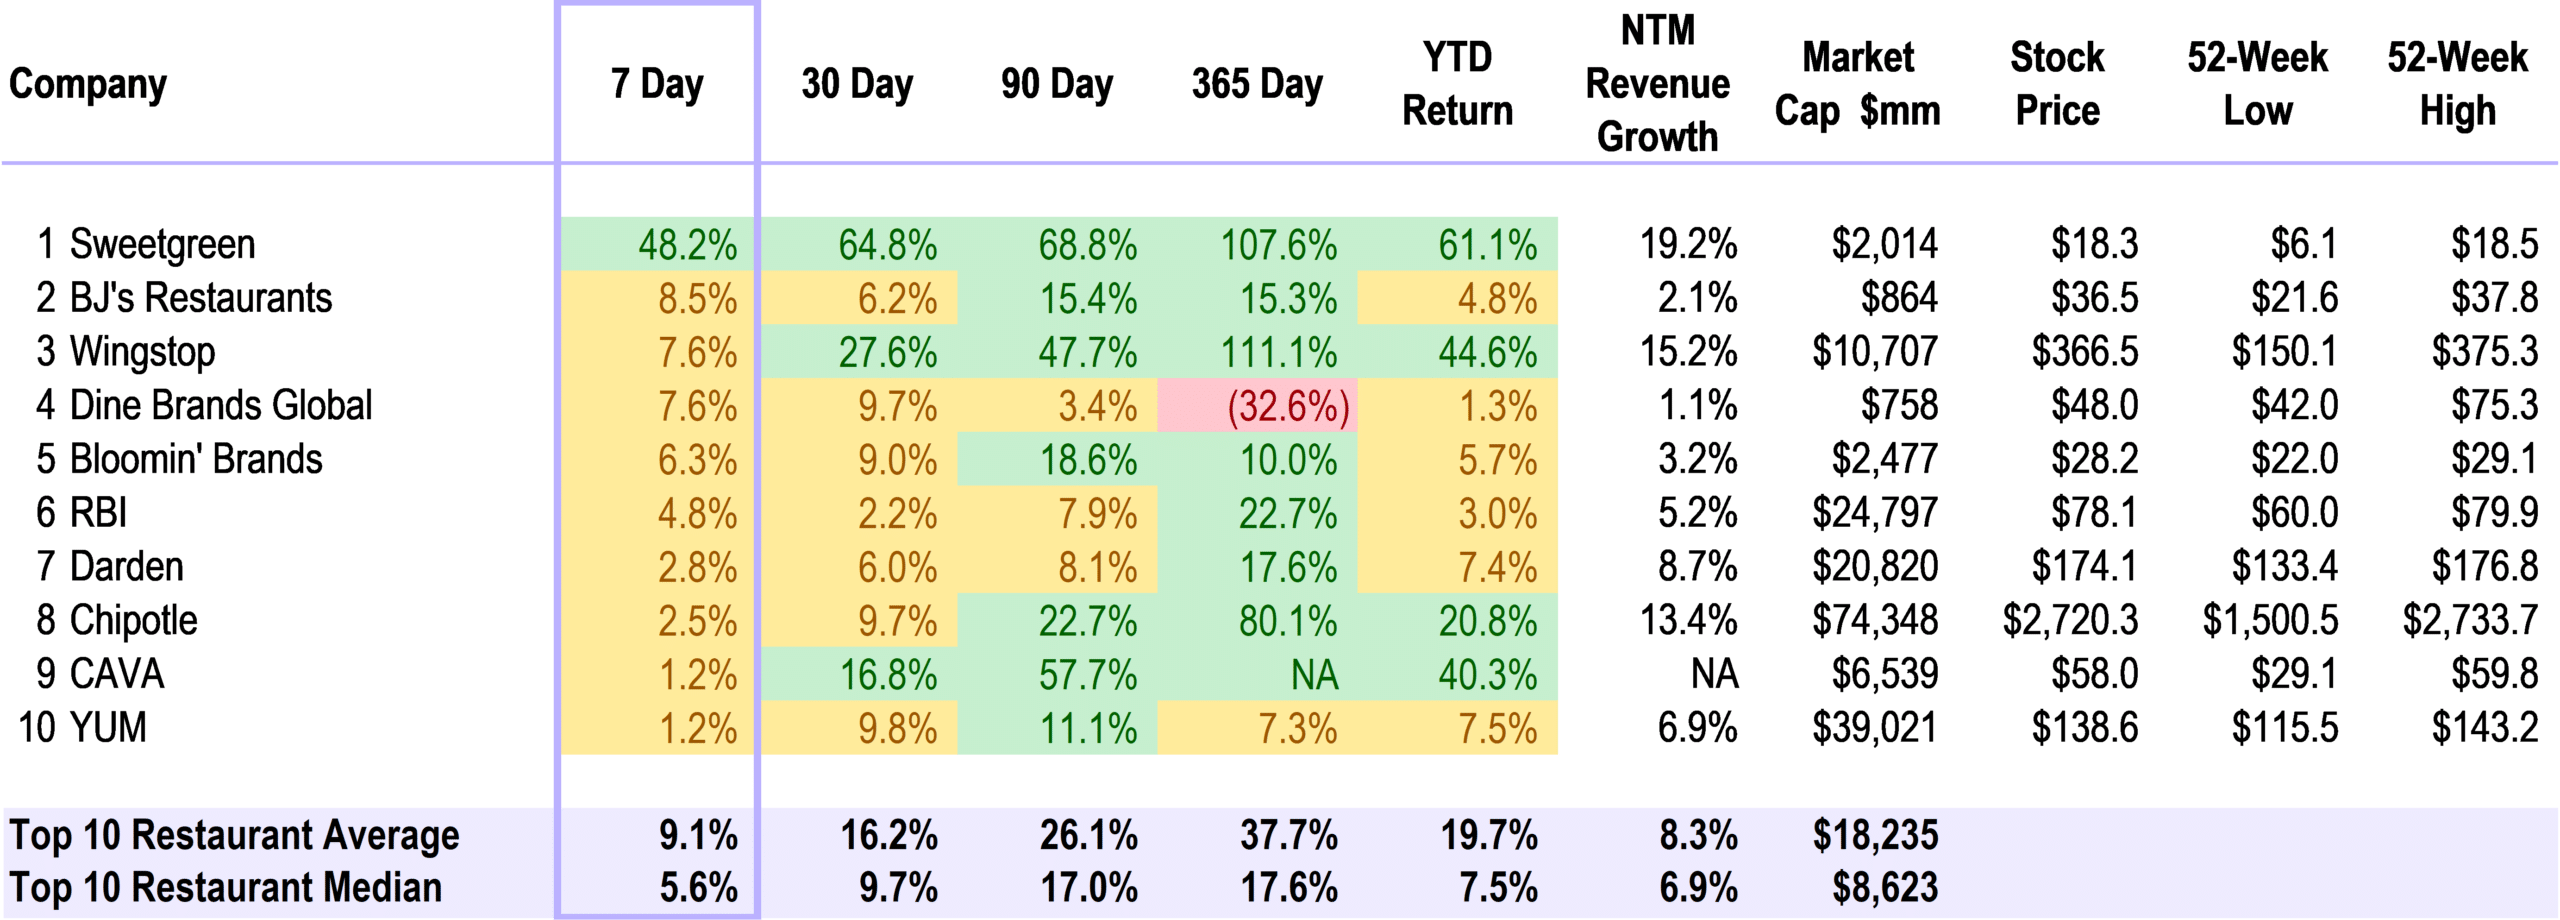
Public Market Top 10 for the Week | Fast Casual Dominates
Sweetgreen leads the top 10 for the week ending March 1st, 2024, with a positive 2023 Q4 earnings report.
Stock Highlight: Sweetgreen
With a fresh Q4 report to look at; here are our top highlights from SG’s 2023 Q4 Report and comparisons to the Fast Casual Cohort.
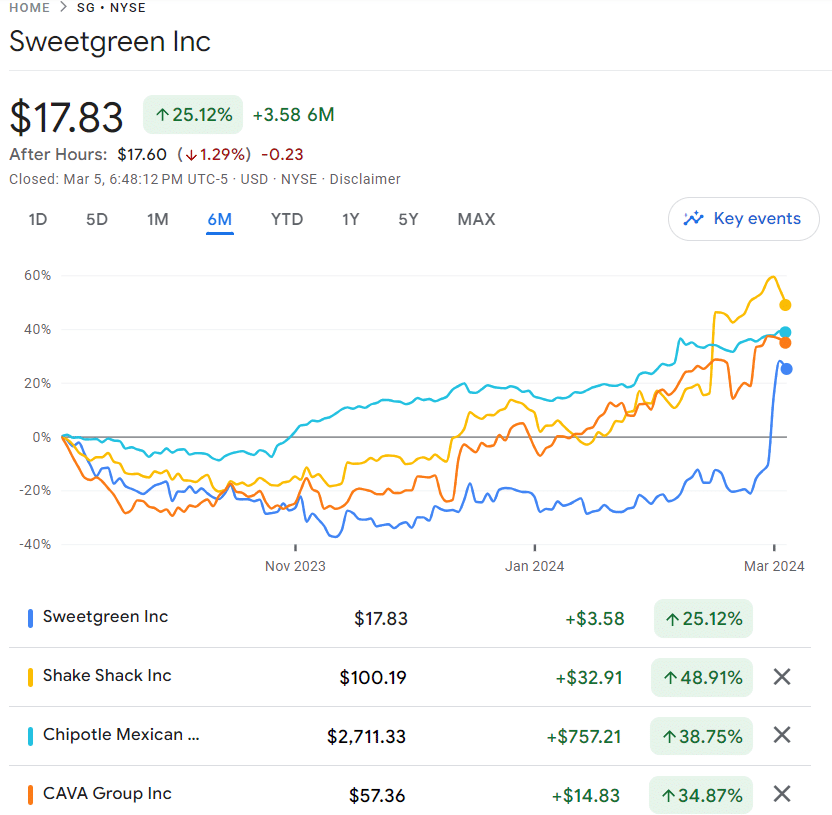
1. The key driver for Sweetgreen’s stock jump this week was its improvement in profitability in addition to its consistent growth trajectory as it opens new locations.
- Restaurant-Level Profit improved by 5% – it was $24.8 million, and Restaurant-Level Profit Margin was 16%, versus Restaurant-Level Profit of $12.8 million and Restaurant-Level Profit Margin of 11% in the prior year period.
2. Revenue Growth:
- Sweetgreen reported total revenue of $153.0 million for Q4 2023, a 29.0% increase compared to the same period in 2022.
- In comparison:
- CAVA achieved revenue growth of 52.5%,
- Shake Shack achieved revenue growth of 20.0%,
- Chipotle achieved revenue growth of 15.4%
3. Same-Store Sales:
- Sweetgreen’s same-store sales rose by 6.0% in Q4 2023, outperforming its 4.0% growth in the prior year.
- In comparison:
- CAVA same-store sales were 11.4%
- Chipotle same-store sales were 8.4%.
- Shake Shack’s same-store sales were 2.8%
Highlights from Annual & Q4 Reports
Looking forward to 2024: Store Growth and Automation
Chipotle – CMG
New Restaurant Openings: The company is on track to open between 255 to 285 new restaurants in the current year and anticipates opening between 285 to 315 new restaurants in 2024, with at least 80% having Chipotlane.
International Expansion: Chipotle opened its first location in Calgary, Canada, with record opening day sales. Plans are in place to improve operations in Europe and to collaborate with Alshaya Group for openings in Kuwait and Dubai
Sweetgreen – SG
Infinite Kitchen Deployment: Sweetgreen anticipates deploying 7 to 9 Infinite Kitchens into new units and 2 to 4 retrofits in 2024. The Infinite Kitchen is expected to create a more efficient assembly process and enhance the customer and employee experience.
New Store Openings: The company plans to open between 23 and 28 new stores during 2024, with the Infinite Kitchen installations weighted towards the back half of the year. The retrofits are planned for high-volume urban stores to understand how the increased throughput will translate into higher revenue and flow-through.
The One Group – STKS
The ONE Group plans to add 8 new venues in 2023, with 6 already opened by the time of the earnings call. Upcoming Openings: For the remainder of the year, they are on track to open 2 new company owned STKs in Boston, Massachusetts, and Salt Lake City, Utah.
Early in 2024, the company plans to open a company-owned STK in Washington, D.C., at the Marriott Grand Marquis, a company-owned STK in Aventura, Florida at the Aventura Mall, and a licensed STK.
Long-term Growth: The ONE Group views their addressable market as 200 STK restaurants globally and 200 Kona Grill restaurants domestically, with best-in-class ROIs of between 40% and 50%
Our Top Article Choices
Deal Making: Transaction Activity
M&A in 2024 Q1
M&A in 2023 Q4
- Authentic Restaurant Brands acquired Fiesta Restaurant Group for $220m
M&A in 2023 Q3
- FTC reportedly investigating Roark’s Subway purchase | The FTC is concerned the deal could create a monopoly in the sandwich segment, as Roark Capital also owns Arby’s, Jimmy John’s, and related chains.
- Subway to be acquired by Roark Capital for $9B. Subway has been going through their sales process since late 2022.
- Bain Capital acquired Fogo de Chao for $560 million after it rapidly grew under Rhone Capital.
- Fat Brands buys Smokey Bones for $30m
M&A in 2023 Q1 & Q2
- Darden acquired Ruth’s Hospitality Group for $715m
- Mohari acquired TAO Group Hospitality for $550m
- Main Squeeze Juice Co. [Conscious Capital] acquired I Love Juice Bar’s 20 units
- SSCP Restaurant Investors bought out bankrupt Corner Bakery for $15m
Market Update: Public Comps
Week Ending | 3/1/2024
Top 10 Monthly Price Movements
The last 90-day performance has been strong with an average of +35% for the Top 10.

This Top 10 cohort has outperformed the S&P and S&P Consumer index over the last year.

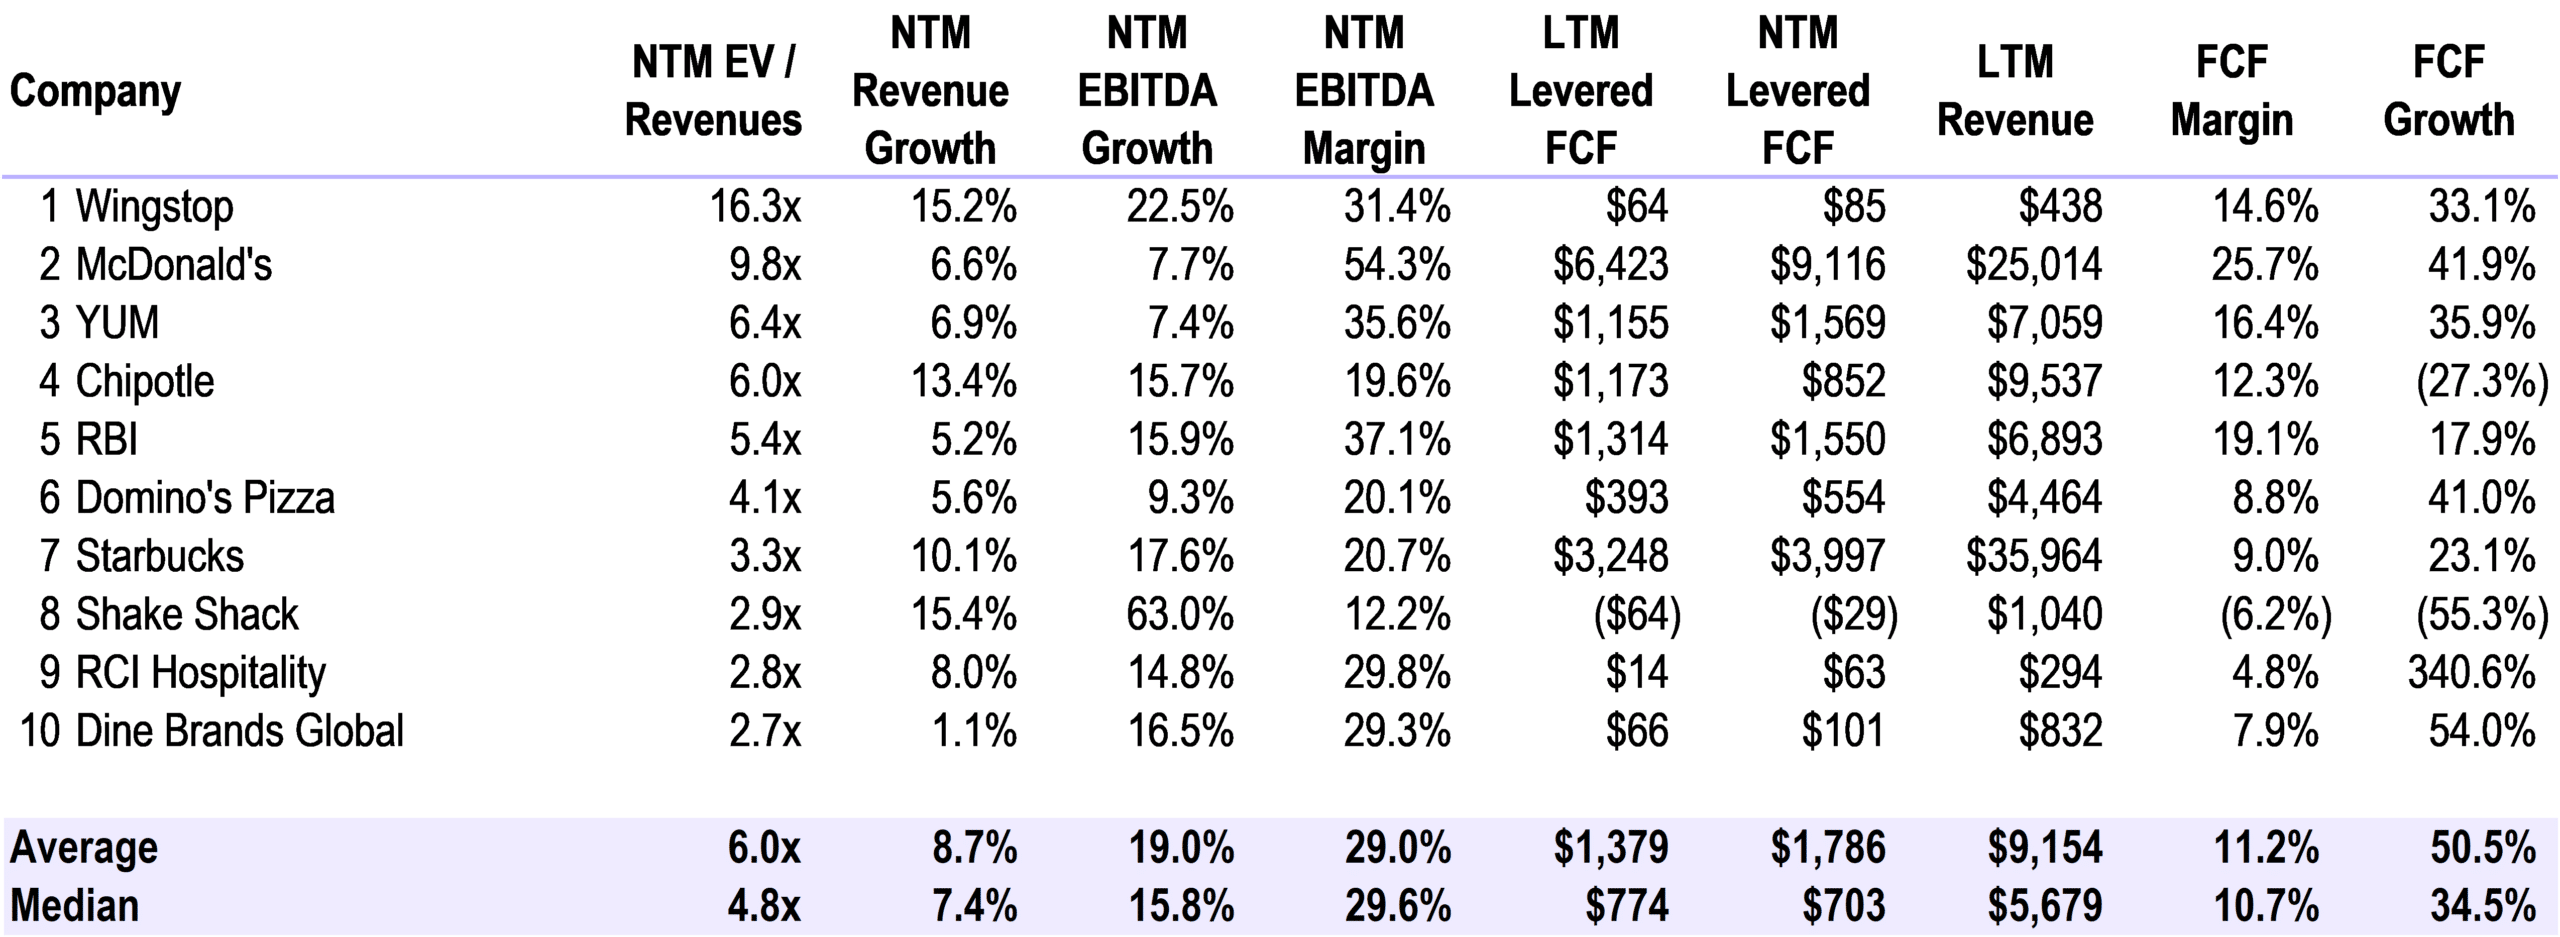
Top 10 Enterprise Value [EV] / NTM Revenue Multiples
The top 10 is made up of mostly Franchisor entities, which have higher multiples than company owned concepts. Consensus revenue growth forecasts estimate ~10% growth into 2024. The growth guidance is attributable to store growth and price increases.
Public Comps – Trends
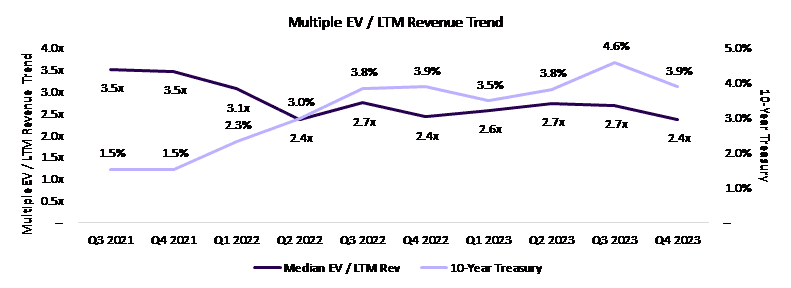
Trend – Enterprise Value [EV] / LTM Revenue Multiples
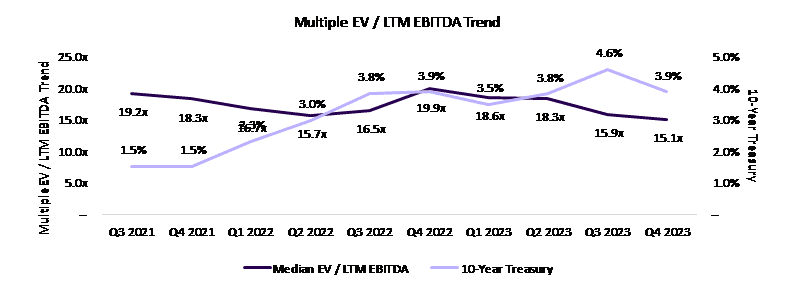
The restaurant industry has seen valuations decline due to interest rate increases.
Trend – Enterprise Value [EV] / LTM EBITDA Multiples
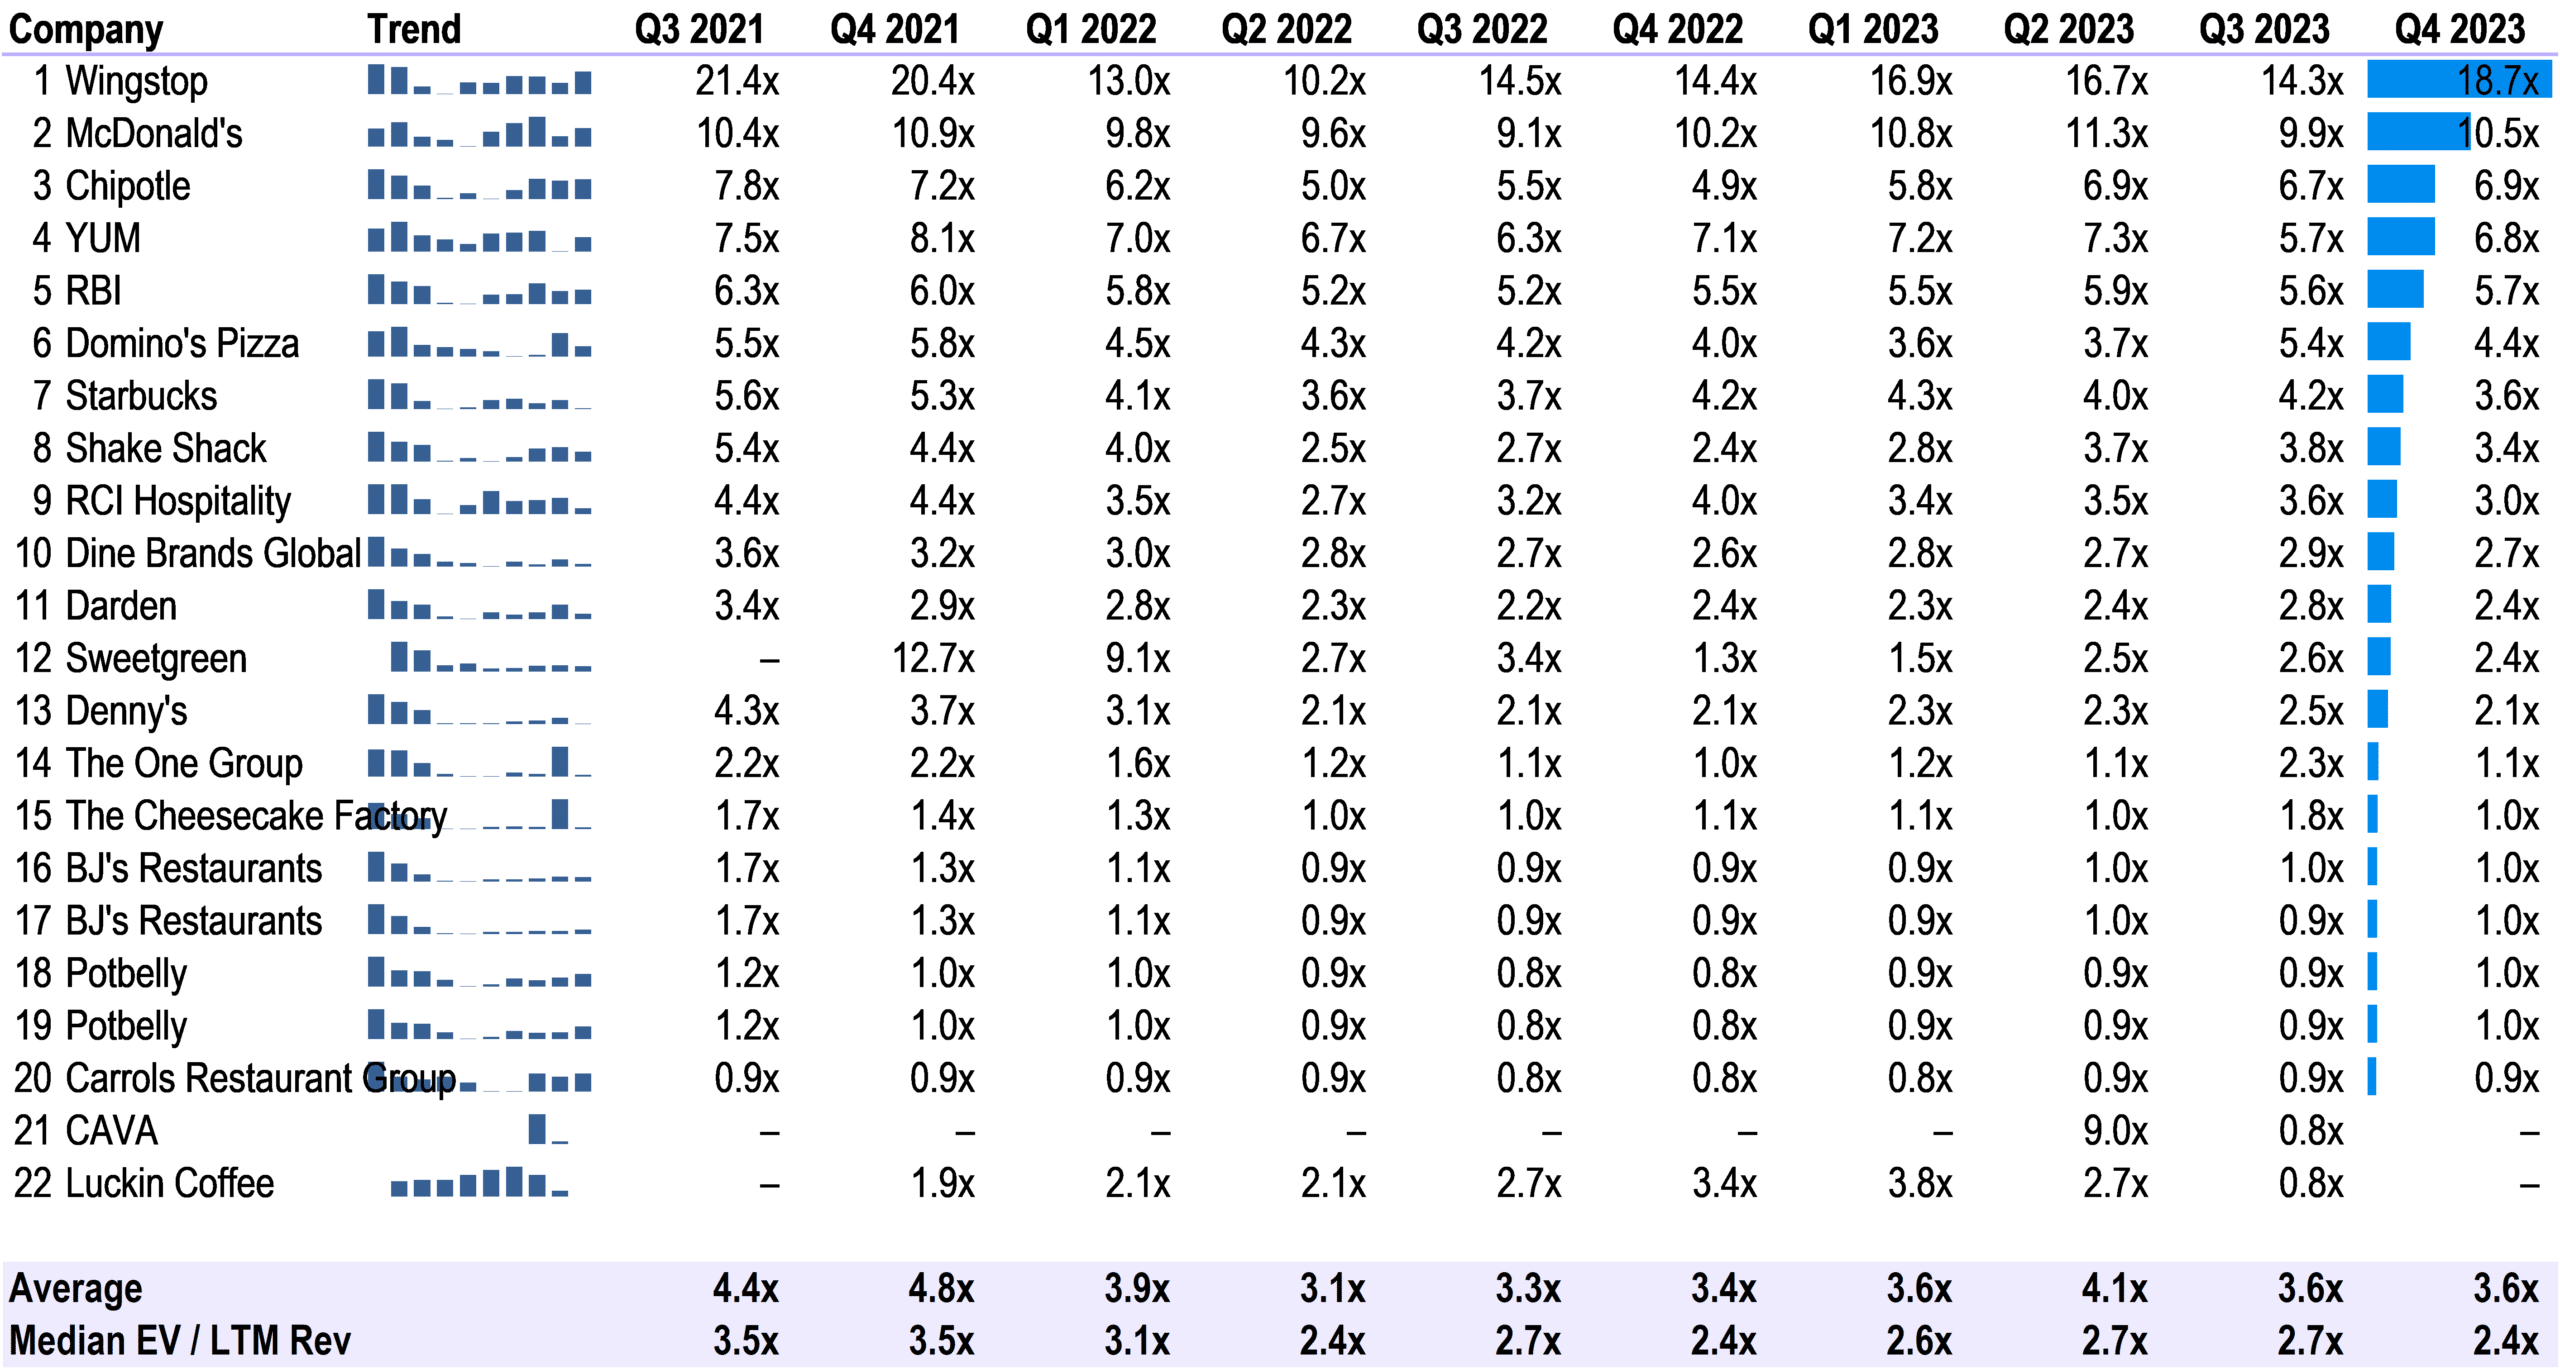
Revenue Multiple Trends
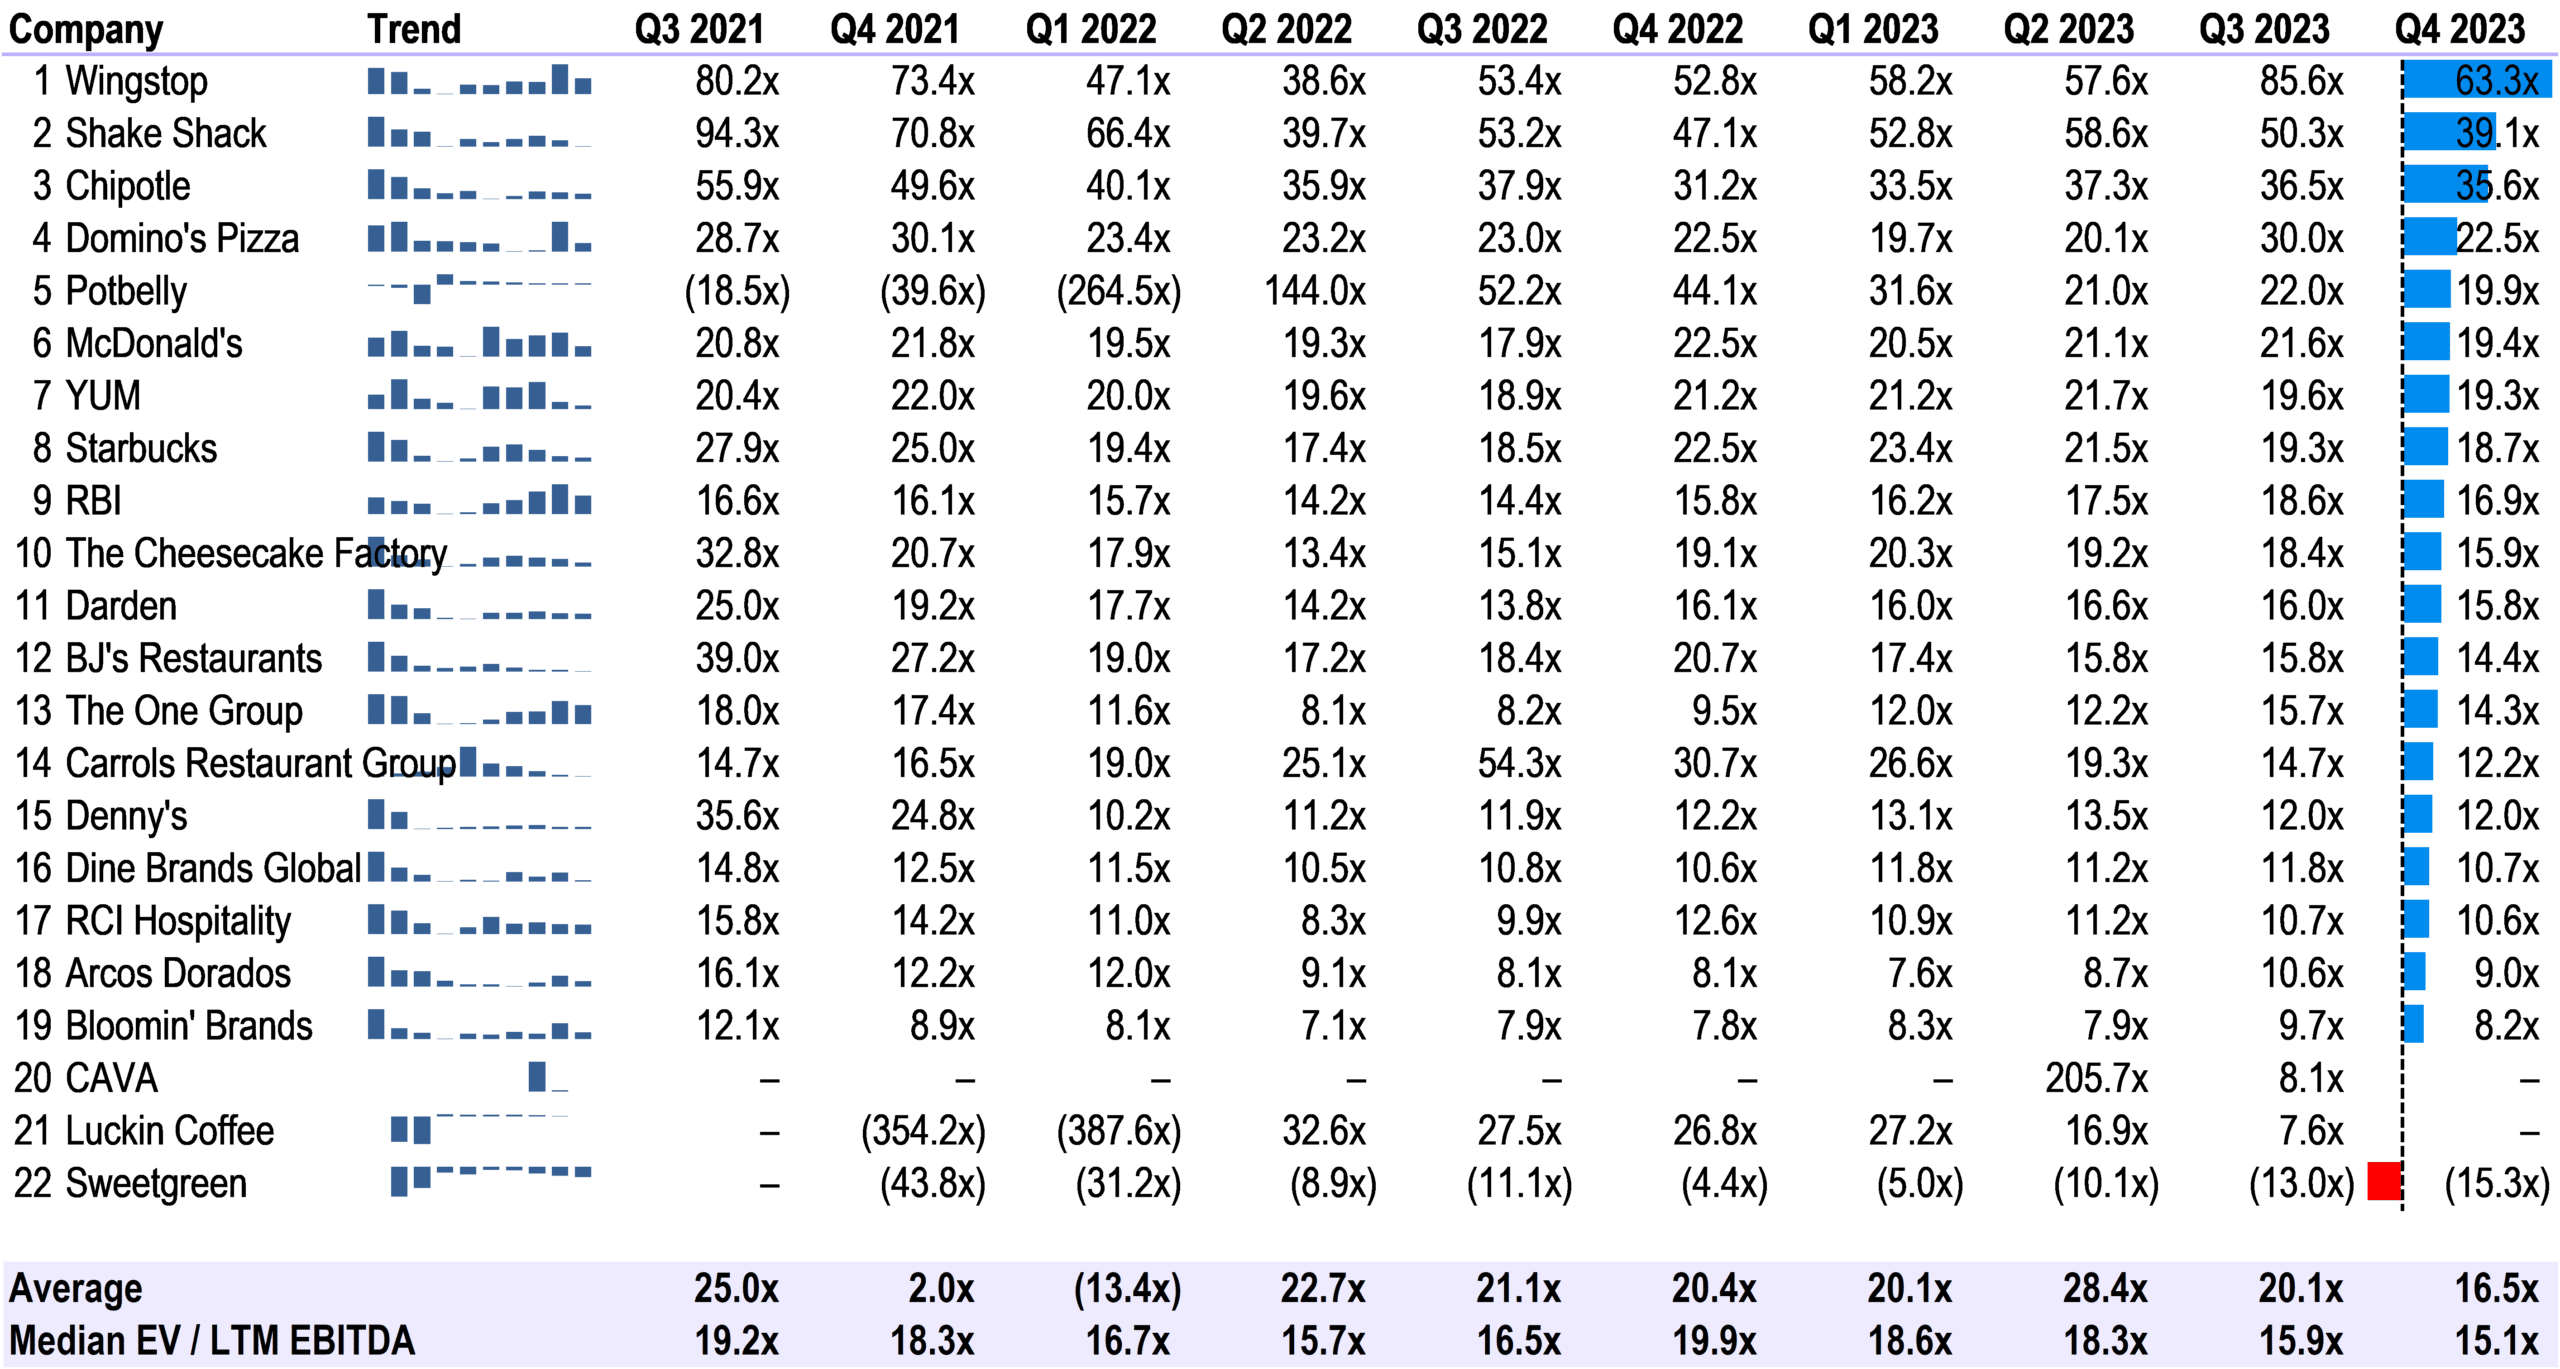
Restaurant businesses are generally valued on multiples of their revenue or EBITDA, depending on their capital structure, growth potential, and franchise model. For example, a McDonald’s franchise has a higher revenue multiple than a company-owned restaurant chain like Shake Shack.
Here are some of the factors that affect restaurant valuation multiples:
- Capital structure: Businesses with less debt and more equity tend to have higher valuation multiples.
- Growth potential: Businesses with high growth potential tend to have higher valuation multiples.
- Franchise model: Franchise businesses tend to have higher valuation multiples than company-owned businesses.
EBITDA Multiple Trends
Sources
TIKR
Bloomberg
Company 10-Q and 10-K Filings
Bureau of Labor Statistics (BLS) [bls.gov]
U.S. Bureau of Economic Analysis (BEA) [bea.gov]
U.S. Department of Agriculture (USDA) Economic Research Service [ers.usda.gov]
Federal Reserve Economic Data (FRED) [fred.stlouisfed.org]
National Restaurant Association [restaurant.org]
International Monetary Fund (IMF) [imf.org]
Disclaimer
The information provided is believed to be from reliable sources, but no liability is accepted for any inaccuracies. This is for information purposes and should not be construed as an investment recommendation. Past performance is no guarantee of future performance.
This post and the information presented are intended for informational purposes only. The views expressed herein are the author’s alone and do not constitute an offer to sell, or a recommendation to purchase, or a solicitation of an offer to buy, any security, nor a recommendation for any investment product or service. While certain information contained herein has been obtained from sources believed to be reliable, neither the author nor any of his employers or their affiliates have independently verified this information, and its accuracy and completeness cannot be guaranteed. Accordingly, no representation or warranty, express or implied, is made as to, and no reliance should be placed on, the fairness, accuracy, timeliness, or completeness of this information. The author and all employers and their affiliated persons assume no liability for this information and no obligation to update the information or analysis contained herein in the future.


