When operating a hospitality business, it’s hard to know if your financial metrics are on par with the industry, especially with a changing economy and unique concept types. From unexpected costs and high rent to fluctuating labor controls, keeping a firm grip on restaurant finances is a continuous marathon. In such an unpredictable environment, it’s not just beneficial, but crucial for operators to understand the fundamental drivers of their business: the numbers.
At Paperchase, our hospitality finance experts have delved deep into data from various restaurant segments within a “high cost of living” metropolitan area. Restaurants that are not in high cost of living areas can still use these metrics as guidance. Simply reduce the benchmark for your category by 2%, and for labor in employer friendly states, reduce by up to 4%.
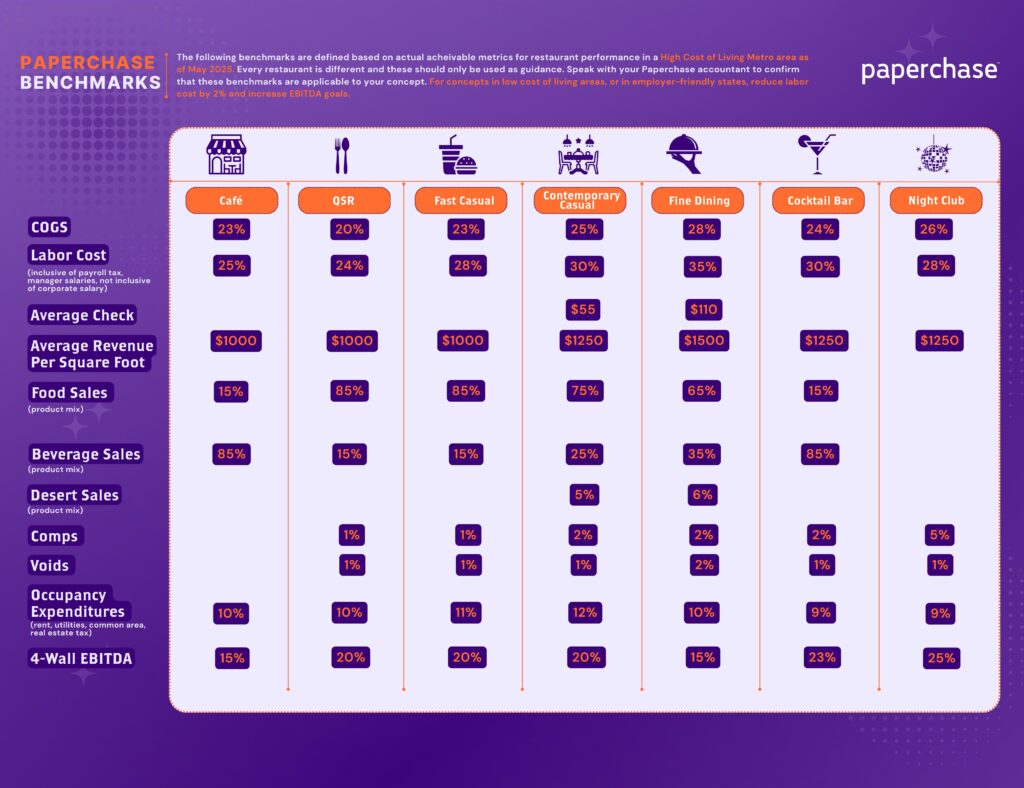
Our analysis provides a clear outline of crucial benchmarks, offering a standard against which restaurant health can be accurately measured and optimized.
Understanding these benchmarks allows operators to identify areas of strength, pinpoint inefficiencies, and make informed decisions to enhance profitability and stability.
Key Benchmarks by Hospitality Segment:
The metrics tracked in hospitality are:
- COGS (Cost of Goods Sold): The direct costs associated with producing the goods a company sells.
- Labor Cost: The cost incurred by a business to pay its staff. Paperchase Senior Account Manager Ruhel Ahmed discusses the nuance of labor costs: “This metric includes employer payroll tax and management salaries. Employee benefits are excluded; however, it should also be included in analyzing actual cost associated with total labor cost.”
- Average Check: This represents the average amount that is spent by each customer dining. The higher the average check, the higher the profitability of the business. Servers are often taught to upsell to raise average check.
- Average Revenue Per Square Foot: The amount of revenue a business makes based on the capacity of the restaurant. Average revenue per square foot is a metric that investors will look for when comparing restaurant profitability to determine how efficient your operations are.
- Food/Beverage Sales: What percentage of your revenue should be coming from food and what percentage of sales are from beverages.
- Comps: This represents complimentary items or service given to guests.
- Voids: This is the cancelation of an order, usually due to error. They differ from comps because the item was never made.
- Occupancy Expenditures: These make up all of the costs associated with the physical space of the business. This can include rent, utilities, and maintenance.
- 4-Wall EBITDA: This is the overall profitability of the business before corporate overhead and other company-wide expenditures are accounted for.
- Note: Items like furniture and maintenance fall under a category known as Cap Ex (capital expenditure). Senior Account Manager Ruhel Ahmed discusses this category: this would include your other income such as space rental, interest income, etc. This would also include corporate taxes, depreciations & amortizations.”
Here’s a breakdown of the key financial benchmarks for different hospitality segments, based on our comprehensive analysis:
Café
Cafes thrive on volume and efficient operations. Their financial health often hinges on a strong beverage program and optimized labor. Customer loyalty and promotions are ways to keep COGS in a café within healthy margins. Many coffee shops implement customer loyalty programs such as punch cards or points to bring in more revenue. Additionally, because almost all revenue in a café comes from beverages, operators must budget to keep their espresso machine and other appliances in working order.
- COGS (Cost of Goods Sold): 23%
- Labor Cost: 25%
- Average Revenue Per Square Foot: $1000
- Food Sales (Product Mix): 15%
- Beverage Sales: 85%
- Occupancy Expenditures (Rent, Utilities, Common Area, Real Estate Tax): 10%
- 4-Wall EBITDA (Earnings Before Interest, Taxes, Depreciation, and Amortization): 15%
Quick Service Restaurant (QSR)
QSRs are characterized by speed, consistency, and a strong focus on food sales. Efficiency in operations and tight cost control are paramount. QSRs are known for a consistent product, meaning operators should have a strong established workflow. Like cafes, many QSRs run app-based loyalty programs and special deals to boost revenue.
- COGS: 20%
- Labor Cost: 24%
- Average Revenue Per Square Foot: $1000
- Food Sales: 85%
- Beverage Sales: 15%
- Comps (Complimentary Items): 1%
- Voids: 1%
- Occupancy Expenditures: 10%
- 4-Wall EBITDA: 20%
Fast Casual
Bridging the gap between QSR and casual dining, fast-casual establishments focus on quality food with quicker service. Balancing ingredient costs with efficient labor is key. For a restaurant emphasizing quality ingredients, the COGS percentage reflects the focus on sourcing better products than a typical QSR, while still aiming for efficiency. Additionally, fast casual restaurants might have slightly higher labor costs than QSR restaurants due to more staff, but still not as high as contemporary casual or fine dining.
- COGS: 23%
- Labor Cost: 28%
- Average Revenue Per Square Foot: $1000
- Food Sales: 85%
- Beverage Sales: 15%
- Comps: 1%
- Voids: 1%
- Occupancy Expenditures: 11%
- 4-Wall EBITDA: 20%
Contemporary Casual
These establishments offer a more relaxed dining experience with a broader menu, often featuring a mix of food and beverage sales. Managing average check size is a critical operational lever for contemporary casual operators. Since the price point is more accessible than fine dining, strategies like effective upselling (e.g., suggesting appetizers, desserts, or premium beverages), offering attractive add-ons, and promoting combo deals or daily specials become vital. The mix of food and beverage sales is also key. While food usually dominates, a well-curated beverage program, including craft beers, wines by the glass, and accessible cocktails can significantly boost the average check and overall profitability.
- COGS: 25%
- Labor Cost: 30%
- Average Check: $55
- Average Revenue Per Square Foot: $1250
- Food Sales: 75%
- Beverage Sales: 25%
- Dessert Sales: 5%
- Comps: 2%
- Voids: 1%
- Occupancy Expenditures: 12%
- 4-Wall EBITDA: 20%
Fine Dining
Fine dining establishments prioritize an exceptional guest experience, which translates to higher labor and COGS. Higher average checks and revenue per square foot are essential to support these costs. In a fine dining restaurant, servers are trained to upsell each table to increase average check. This includes having a strong knowledge of the menu and drink offerings. Another key element of fine dining is utilizing reservations and headcount to maximize guest traffic. The host should have an idea of how many guests are on the books each shift and run the restaurant accordingly. This maximizes revenue for the business. Additionally, in a fine dining establishment, inventory management is essential for getting an accurate picture of your COGS and making adjustments to menu pricing and ordering accordingly.
- COGS: 28%
- Labor Cost: 35%
- Average Check: $110
- Average Revenue Per Square Foot: $1500
- Food Sales: 65%
- Beverage Sales: 35%
- Dessert Sales: 6%
- Comps: 2%
- Voids: 2%
- Occupancy Expenditures: 10%
- 4-Wall EBITDA: 15%
Cocktail Bar
Efficient inventory management and skilled bartenders are crucial in cocktail bars. Cocktail bars generally have lower COGS than fine dining or contemporary casual restaurants because most of their purchases are alcohol, which deliver higher margins. They also benefit from the majority of their inventory not being perishable. Because beverage sales make up most of their revenues, cocktail bar owners should focus on staff that have a deep understanding of the product they sell to boost revenue. Cocktail bar operators should always be trying to sell bottles that have been sitting for an extended period, especially wine. Pushing low selling inventory through specials or discounts is a way to improve cash flow and COGS in a cocktail bar.
- COGS: 24%
- Labor Cost: 30%
- Average Revenue Per Square Foot: $1250
- Food Sales: 15%
- Beverage Sales: 85%
- Comps: 2%
- Voids: 1%
- Occupancy Expenditures: 9%
- 4-Wall EBITDA: 23%
Nightclub
Nightclubs are driven by high volume and operational complexity. Strong beverage sales and effective crowd management are key to their profitability. Nightclubs are similar to cocktail bars, but with a few unique determining factors. For example, nightclubs have a 5% comps rate than the other operations we analyzed. This is due to more promotions, VIP guests, or complimentary drinks given to drive loyalty. Even though nightclubs have a relatively low labor cost compared to fine dining, operators must still consider the cost of hiring contract employees such as DJs, performers, and security.
- COGS: 26%
- Labor Cost: 28%
- Average Revenue Per Square Foot: $1250
- Comps: 5%
- Voids: 1%
- Occupancy Expenditures: 9%
- 4-Wall EBITDA: 25%

Utilizing These Benchmarks
To effectively manage and hit their respective COGS benchmarks, operators across these segments can implement several strategies. For Fine Dining, given its high COGS, meticulous inventory management is paramount. This includes implementing robust perpetual inventory systems to track high-value ingredients in real-time, minimizing waste through precise portion control and yield management in the kitchen, and negotiating favorable pricing with multiple premium suppliers to secure the best quality at competitive rates. For instance, a fine dining establishment might track expensive cuts of meat daily, ensure chefs adhere strictly to recipe cards to prevent over-portioning, and regularly bid out produce contracts to multiple local farms.
Cocktail Bars and Nightclubs, with their lower beverage-focused COGS, can focus on optimizing pour costs. This involves training bartenders on accurate pouring techniques using jiggers or measured pour spouts to prevent over-pouring, implementing regular inventory counts (weekly or bi-weekly) to identify discrepancies and potential theft, and leveraging volume discounts from liquor distributors. For example, a cocktail bar might conduct daily inventory checks on its most popular spirits, utilize smart pour spouts that track liquor dispensed, and purchase popular brands in larger quantities to reduce per-unit cost. All three types of establishments can benefit from menu engineering, strategically pricing items with lower COGS and higher perceived value, and supplier relationship management, building strong ties with vendors for consistent quality and potential bulk discounts.
Paperchase’s hospitality finance experts work directly with operators to help them hit these benchmarks and keep their bottom line in check. Through weekly and monthly financial reporting, your personalized team will help you take steps to improve your metrics and achieve the profitability your restaurant deserves. Get in touch for more information.