The Perfect Plate – 2025 Q1
Q1 2025 presented a mixed picture for U.S. restaurant operators. While revenue growth continued…

2025 Q1 Earnings Report Summary
Overview:
Q1 2025 presented a mixed picture for U.S. restaurant operators. While revenue growth continued for many brands, macroeconomic headwinds, new tariffs, and shifting consumer behavior led to uneven comparable sales performance. Executive teams focused on supply chain strategy, pricing discipline, and consumer segmentation to weather the turbulence.
Key Takeaway | Two Guests, Two Strategies — and a Growing Divide
Operators are navigating a tale of two diners: the value-seeker and the experience-driven loyalist. This is leading to very different strategies across the board, and the winners are the ones who know exactly which guest they’re building for.
The Value-First Crowd – Weaker SSS Performance
McDonald’s, Burger King (RBI), and Wendy’s are all doubling down on affordability. Think bundled deals, limited-time discounts, and aggressive value messaging. These brands are laser-focused on retaining low- to middle-income guests who are trading down or visiting less often. Their playbook is all about keeping the doors open to price-sensitive customers without completely sacrificing margin.
The Experience Builders – Stronger SSS Performance
CAVA, Texas Roadhouse, and The Cheesecake Factory are going the other way — investing in throughput, hospitality, and fresh menu ideas. They’re banking on a more resilient premium guest who’s still willing to dine out if the value is clear, even at a higher price point. These brands are focused on long-term loyalty and market share, not chasing short-term foot traffic.
Holding the Line & Winning on Consistency
Interestingly, some of the strongest performers are those that aren’t using aggressive discounting — instead, they’re focused on delivering consistency, keeping prices stable, and expanding their footprint smartly. These brands understand that value isn’t always about lower prices — it’s about reliable service, quality, and the overall guest experience.
Q1 Performance Snapshot & Rankings
| Company | Same Store Sales | Executive Focus |
| CAVA | +10.8% | Domestic supply chain, menu consistency, steady pricing |
| Texas Roadhouse | +3.5% | Traffic growth, selective pricing |
| Yum! Brands | +3.0% | Strong Taco Bell U.S. and KFC international performance |
| Cheesecake Factory | +1.0% | Menu innovation, labor retention |
| Wingstop | +0.5% | Record openings, digital sales growth |
| Shake Shack | +0.2% | Operational improvements, menu testing |
| RBI | +0.1% | Traffic headwinds, cautious optimism for Q2 |
| Chipotle | -0.4% | Supplier diversification, weather disruptions |
| Sweetgreen | -3.1% | Operational reset, guest experience initiatives |
| McDonald’s (U.S.) | -3.6% | Income-driven traffic declines, value menu focus |
| The ONE Group | -3.2% | Expansion-led revenue growth, short-term comp softness |
Outlook for Remainder of 2025
- Traffic recovery expected in H2 as economic conditions stabilize.
- Strategic investments in supply chain, digital ordering, and menu development will remain top priorities.
- Brands embracing agility, customer loyalty, and margin control are best positioned for sustained growth.
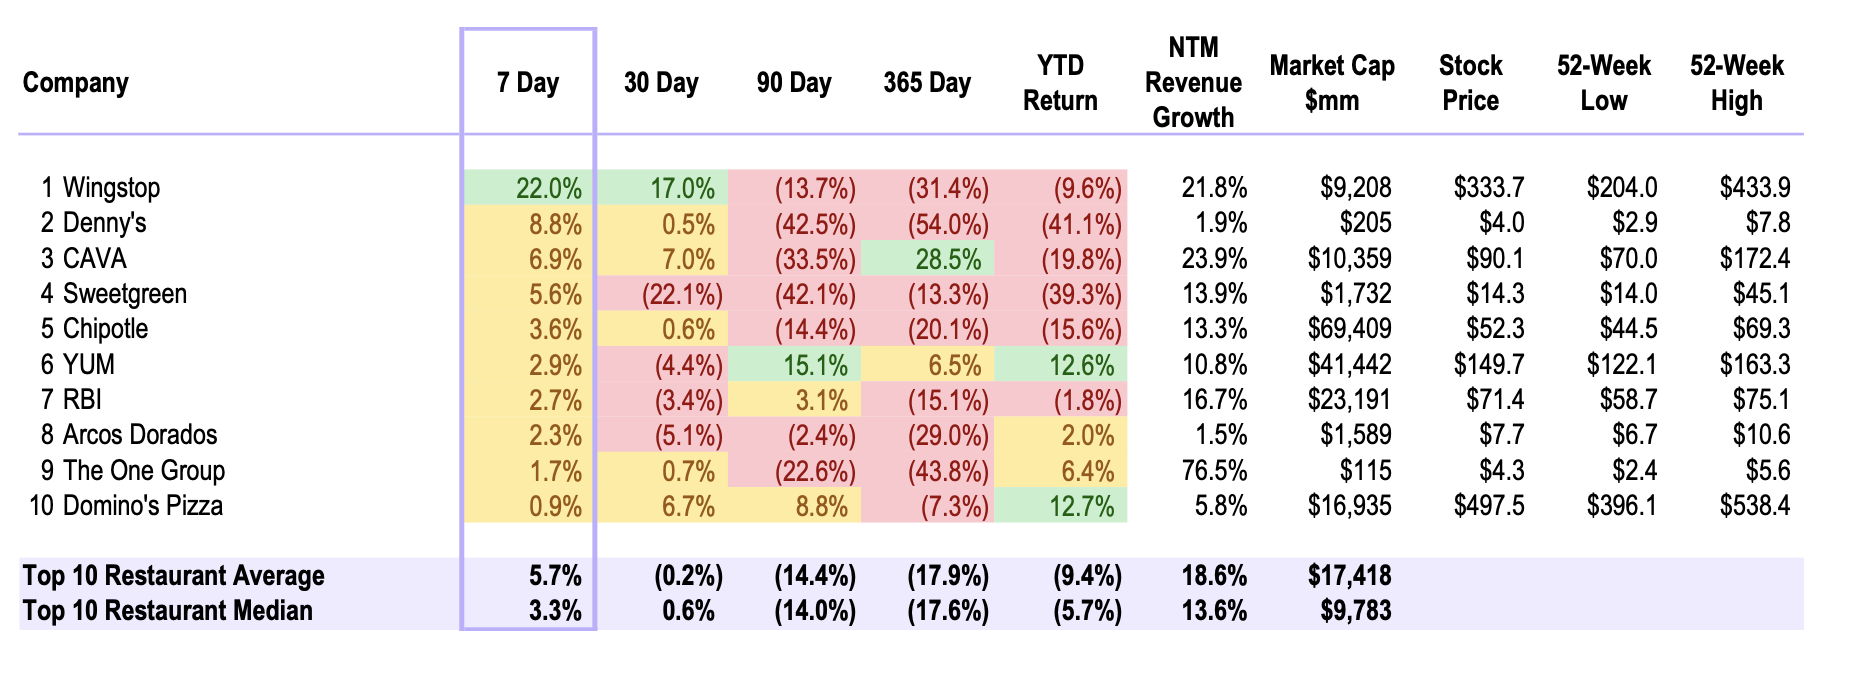
Public Market Top 10 for the Week
Starbucks leads the top 10 for the week ending Wednesday, April 30, 2025.
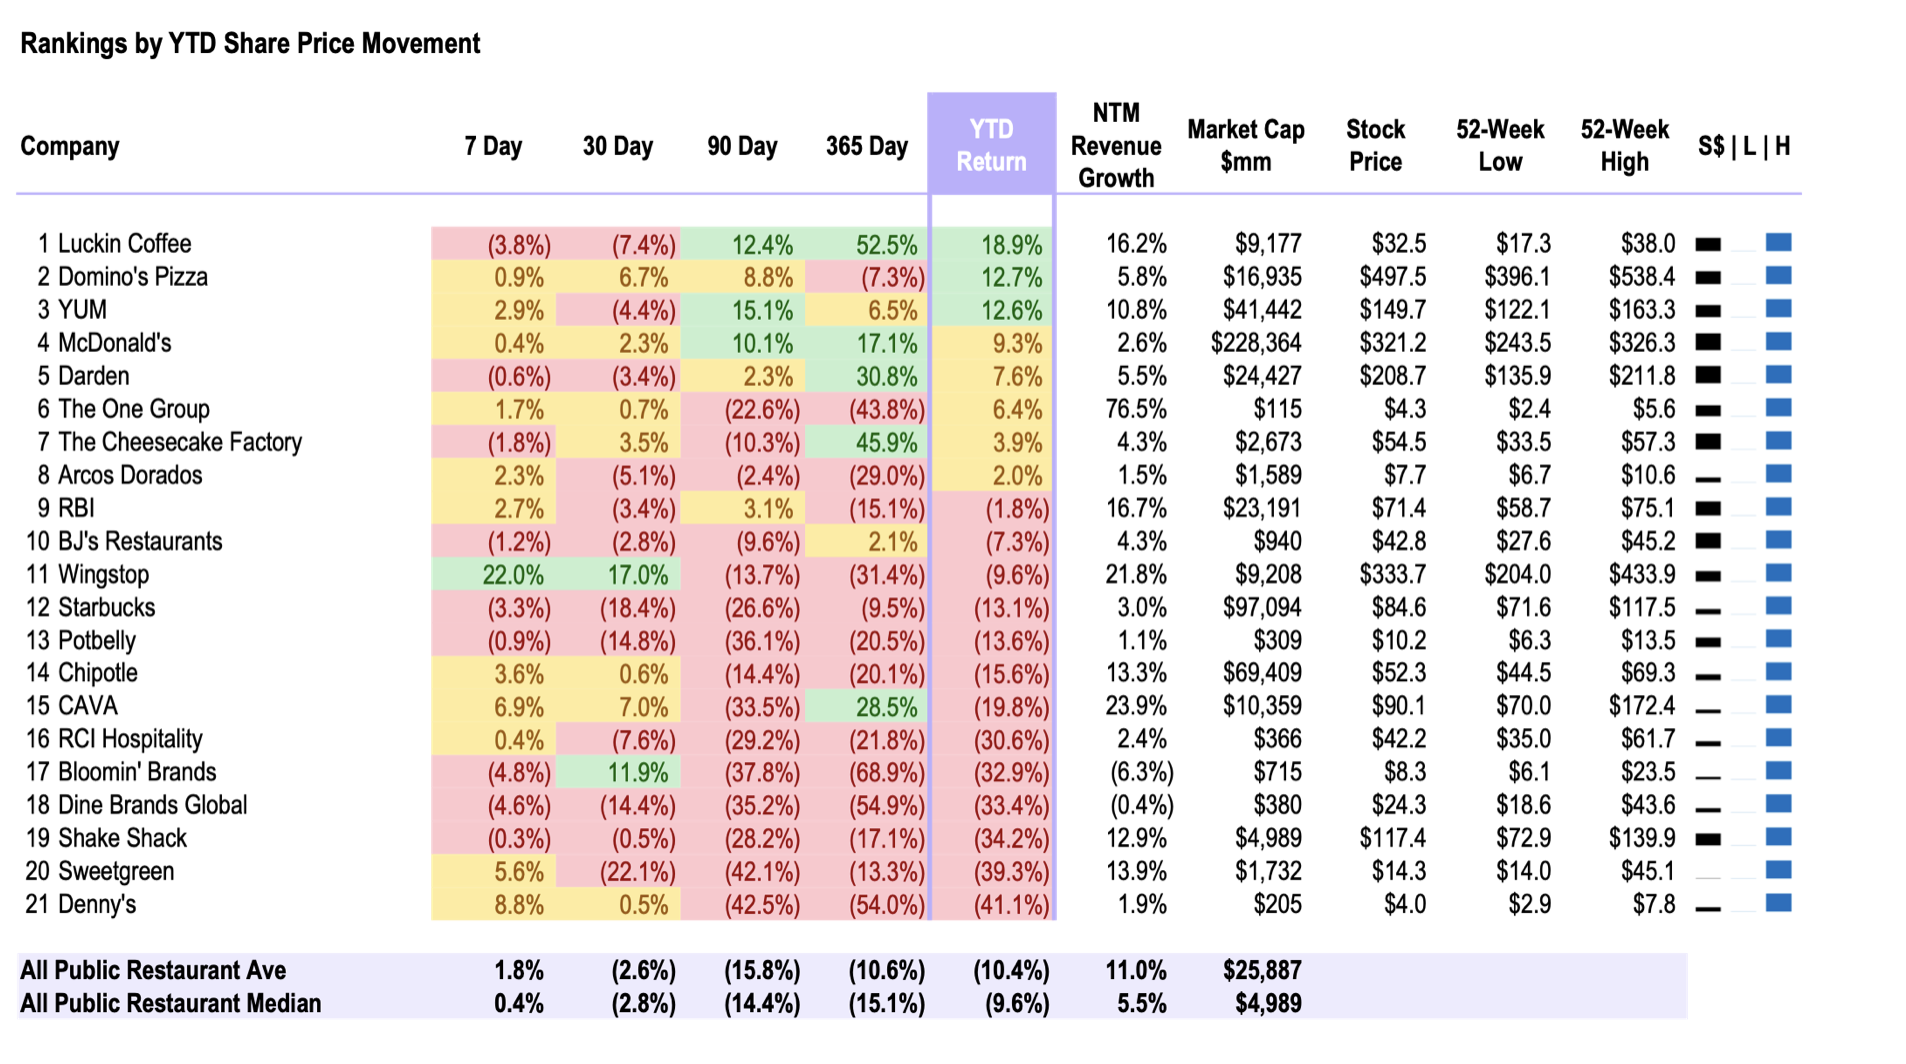
Public Market Summary for YTD Returns
Our Top Article Choices
- NRA: Economic Indicators – Same-store sales and customer traffic – Link
- 8 restaurant trends to watch in 2025 – Link
- Chipotle’s Comparable Sales Dropped Year Over Year… – Link
- Toast Data: Reservation trends shift to slower days and early dinners – Link
- WSJ – Are value meals worth it for restaurants? – Link
Deal Making: Transaction Activity
M&A in 2024 Q4 – 2025 Q1
- DoorDash Expands with Deliveroo and SevenRooms Acquisitions – Link
- Deliveroo – Deal Value: $3.9 billion
- Details: DoorDash announced its acquisition of U.K.-based food delivery service Deliveroo,
enhancing its international presence.
- Details: DoorDash announced its acquisition of U.K.-based food delivery service Deliveroo,
- SevenRooms – Deal Value: $1.2 billion
- Deliveroo – Deal Value: $3.9 billion
- Wonder to acquire Grubhub for $650m – Link
- TGI Fridays Sells Corporate-Owned Locations Amid Bankruptcy – Link
- TGI Fridays received court approval to sell nine of its 39 corporate-owned locations to Mexico-based
MERA for $34.5 million, as part of its bankruptcy proceedings.
- TGI Fridays received court approval to sell nine of its 39 corporate-owned locations to Mexico-based
- Jersey Mike’s has agreed to sell a majority stake to Blackstone – Link
Market Update: Public Comps
Week Ending | 4/30/2025
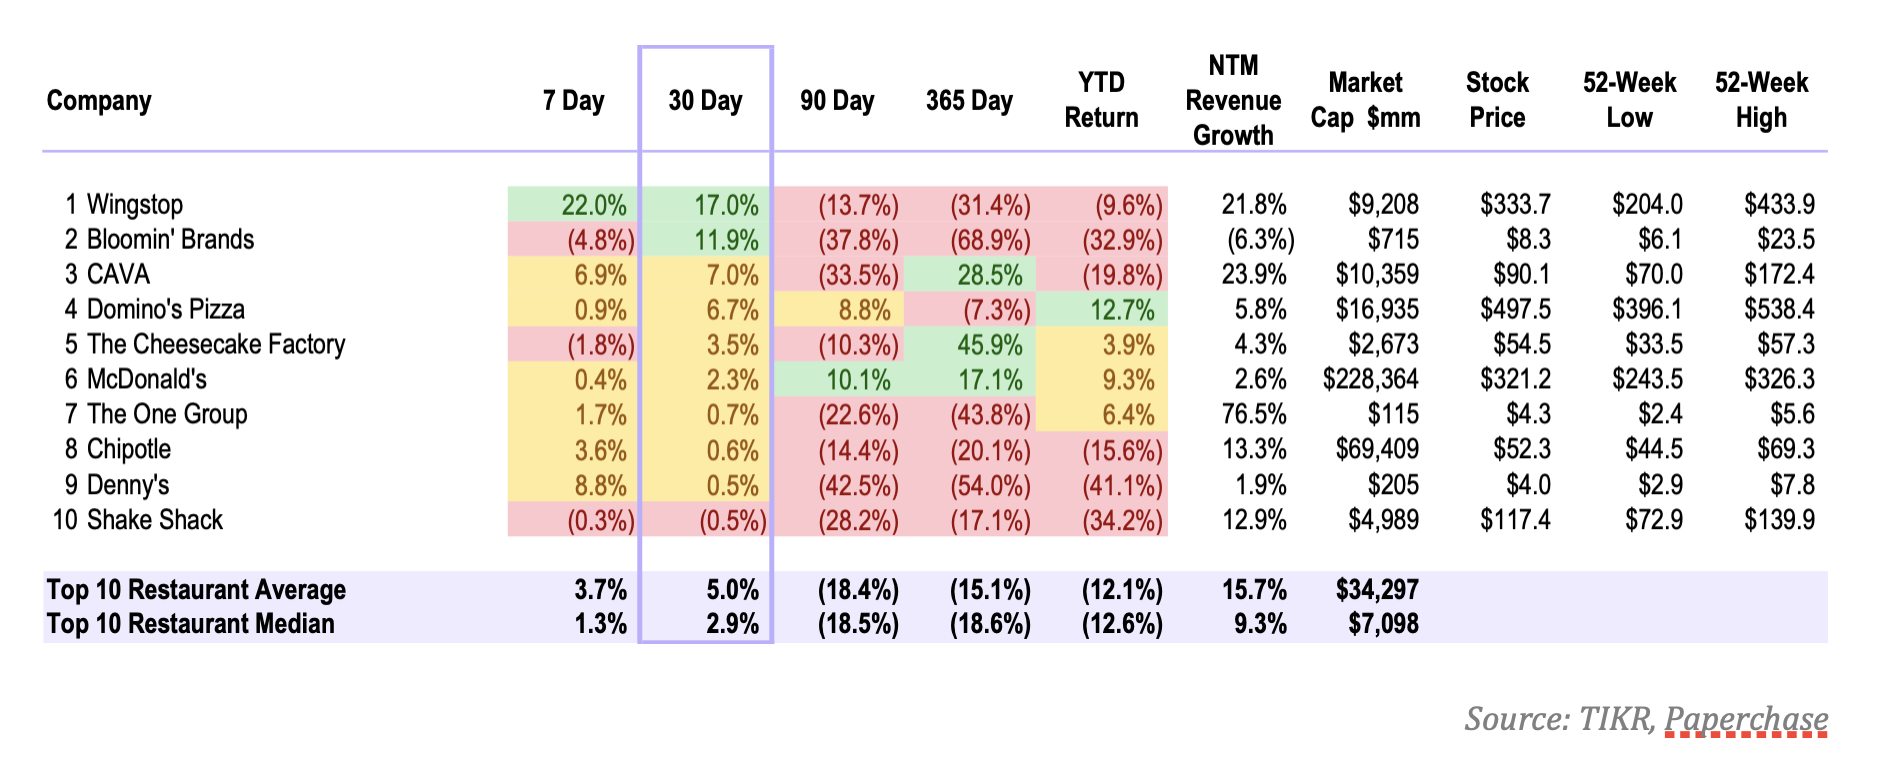
Top 10 Monthly Price Movements
The last 30-day performance had an average of 0.9% for the Top 10.
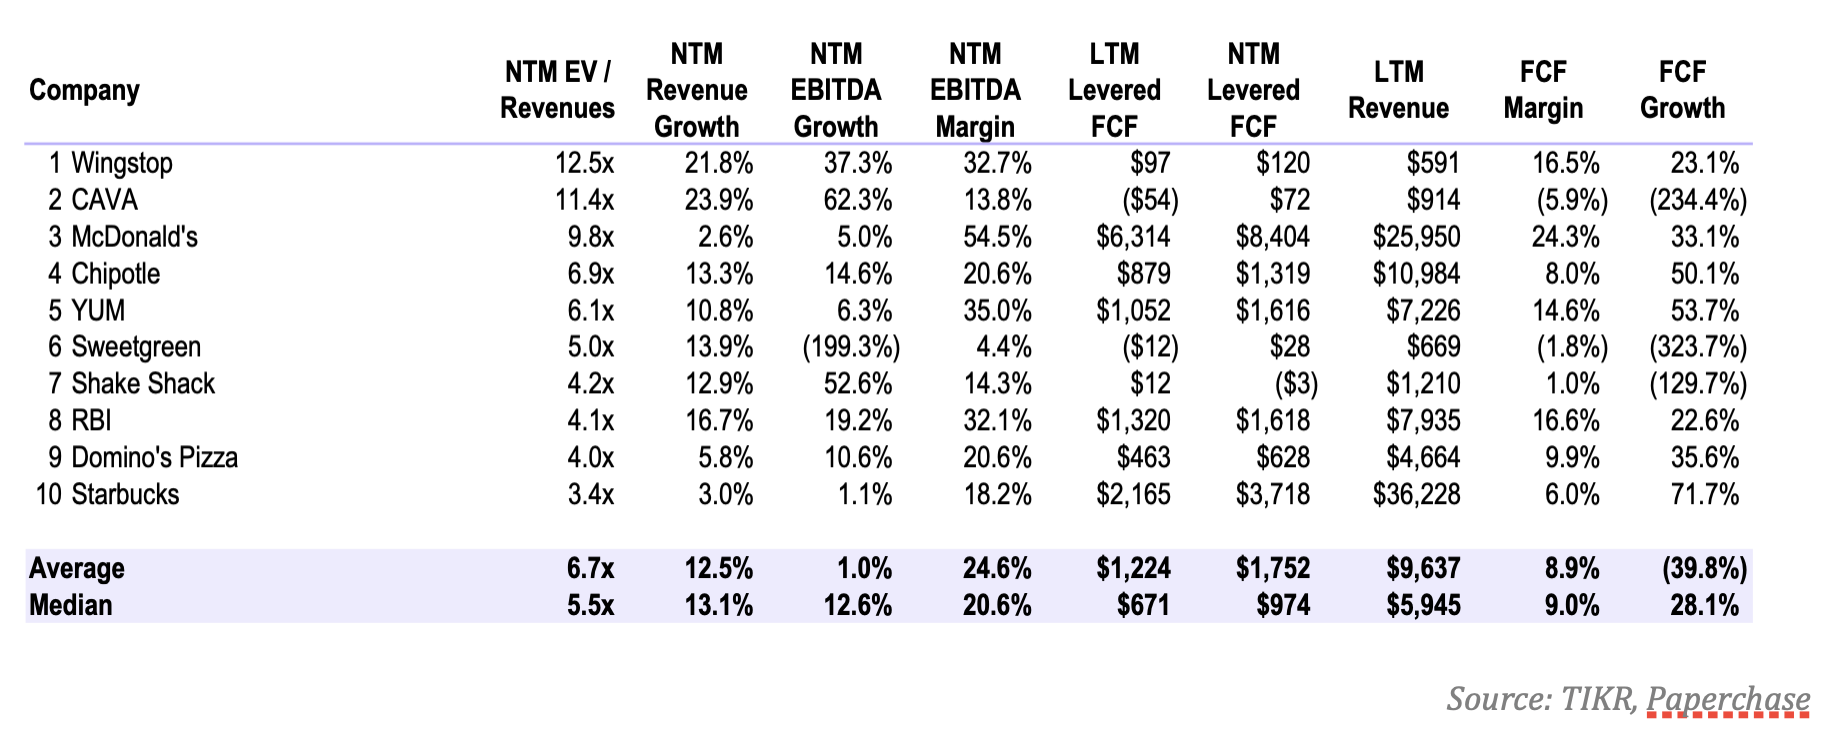
Top 10 Enterprise Value [EV] / NTM Revenue Multiples
The top 10 is made up of mostly Franchisor entities, which have higher multiples than company owned concepts. Consensus revenue growth forecasts estimate ~12.5% growth into 2025. The growth guidance is attributable to store growth and price increases.
Public Comps – Trends
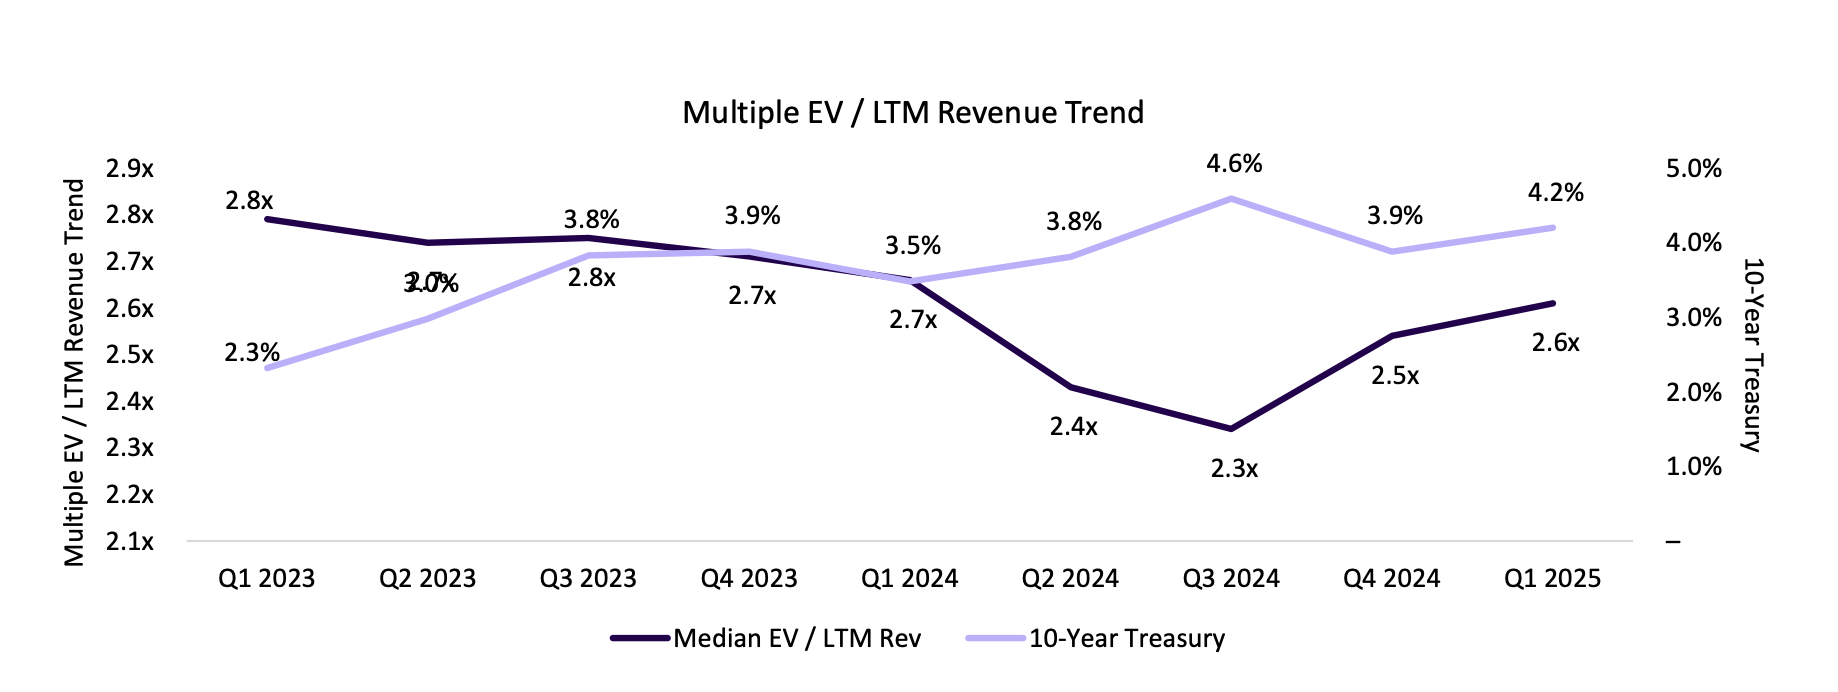
Trend – Enterprise Value [EV] / LTM Revenue Multiples
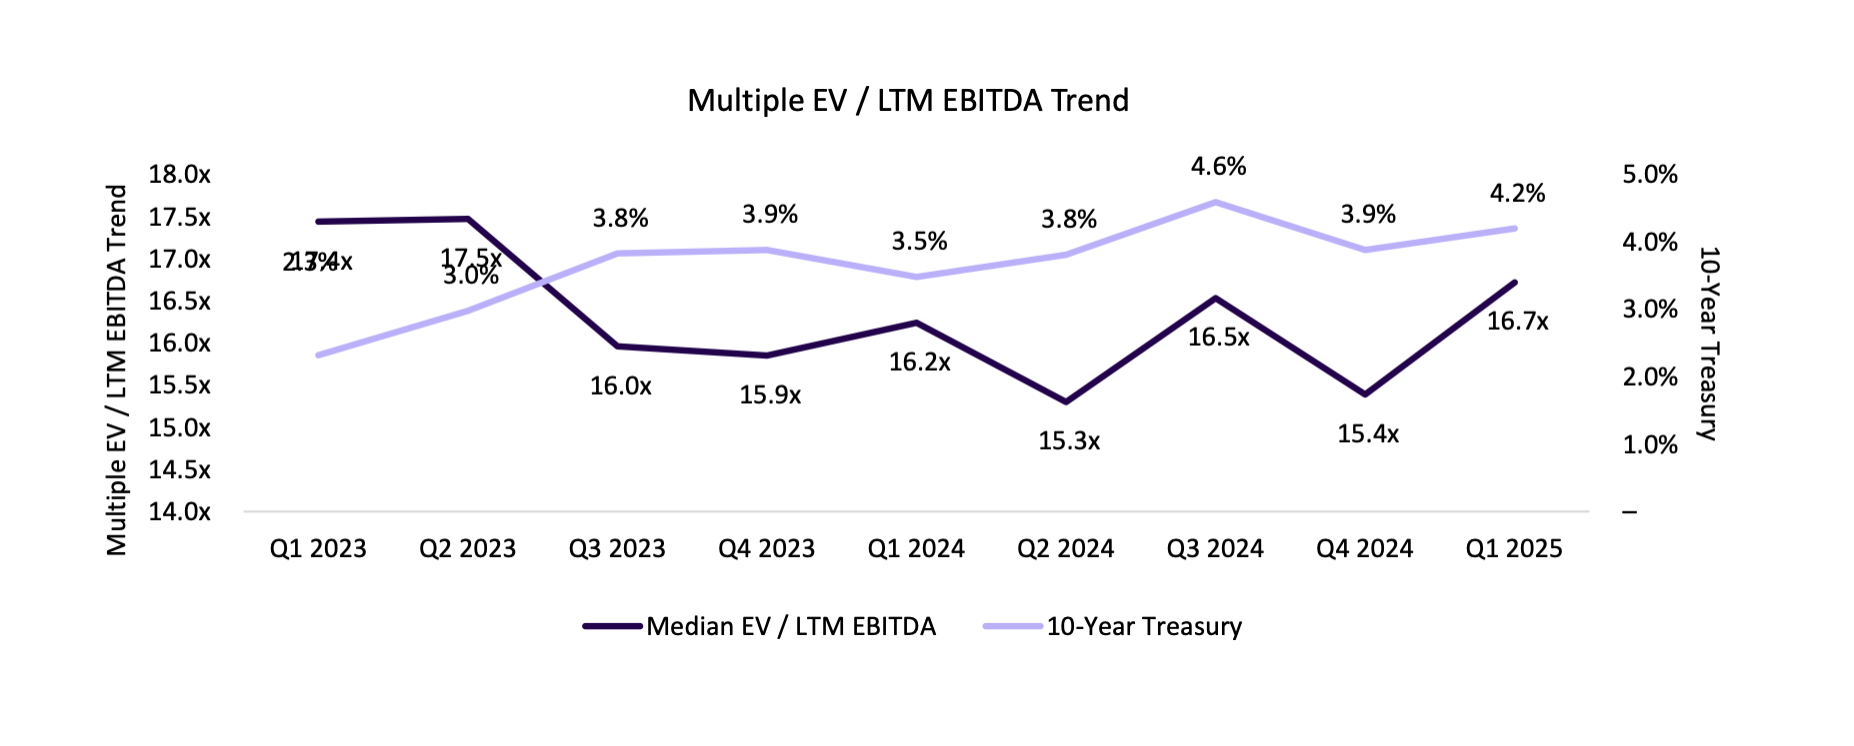
Trend – Enterprise Value [EV] / LTM EBITDA Multiples
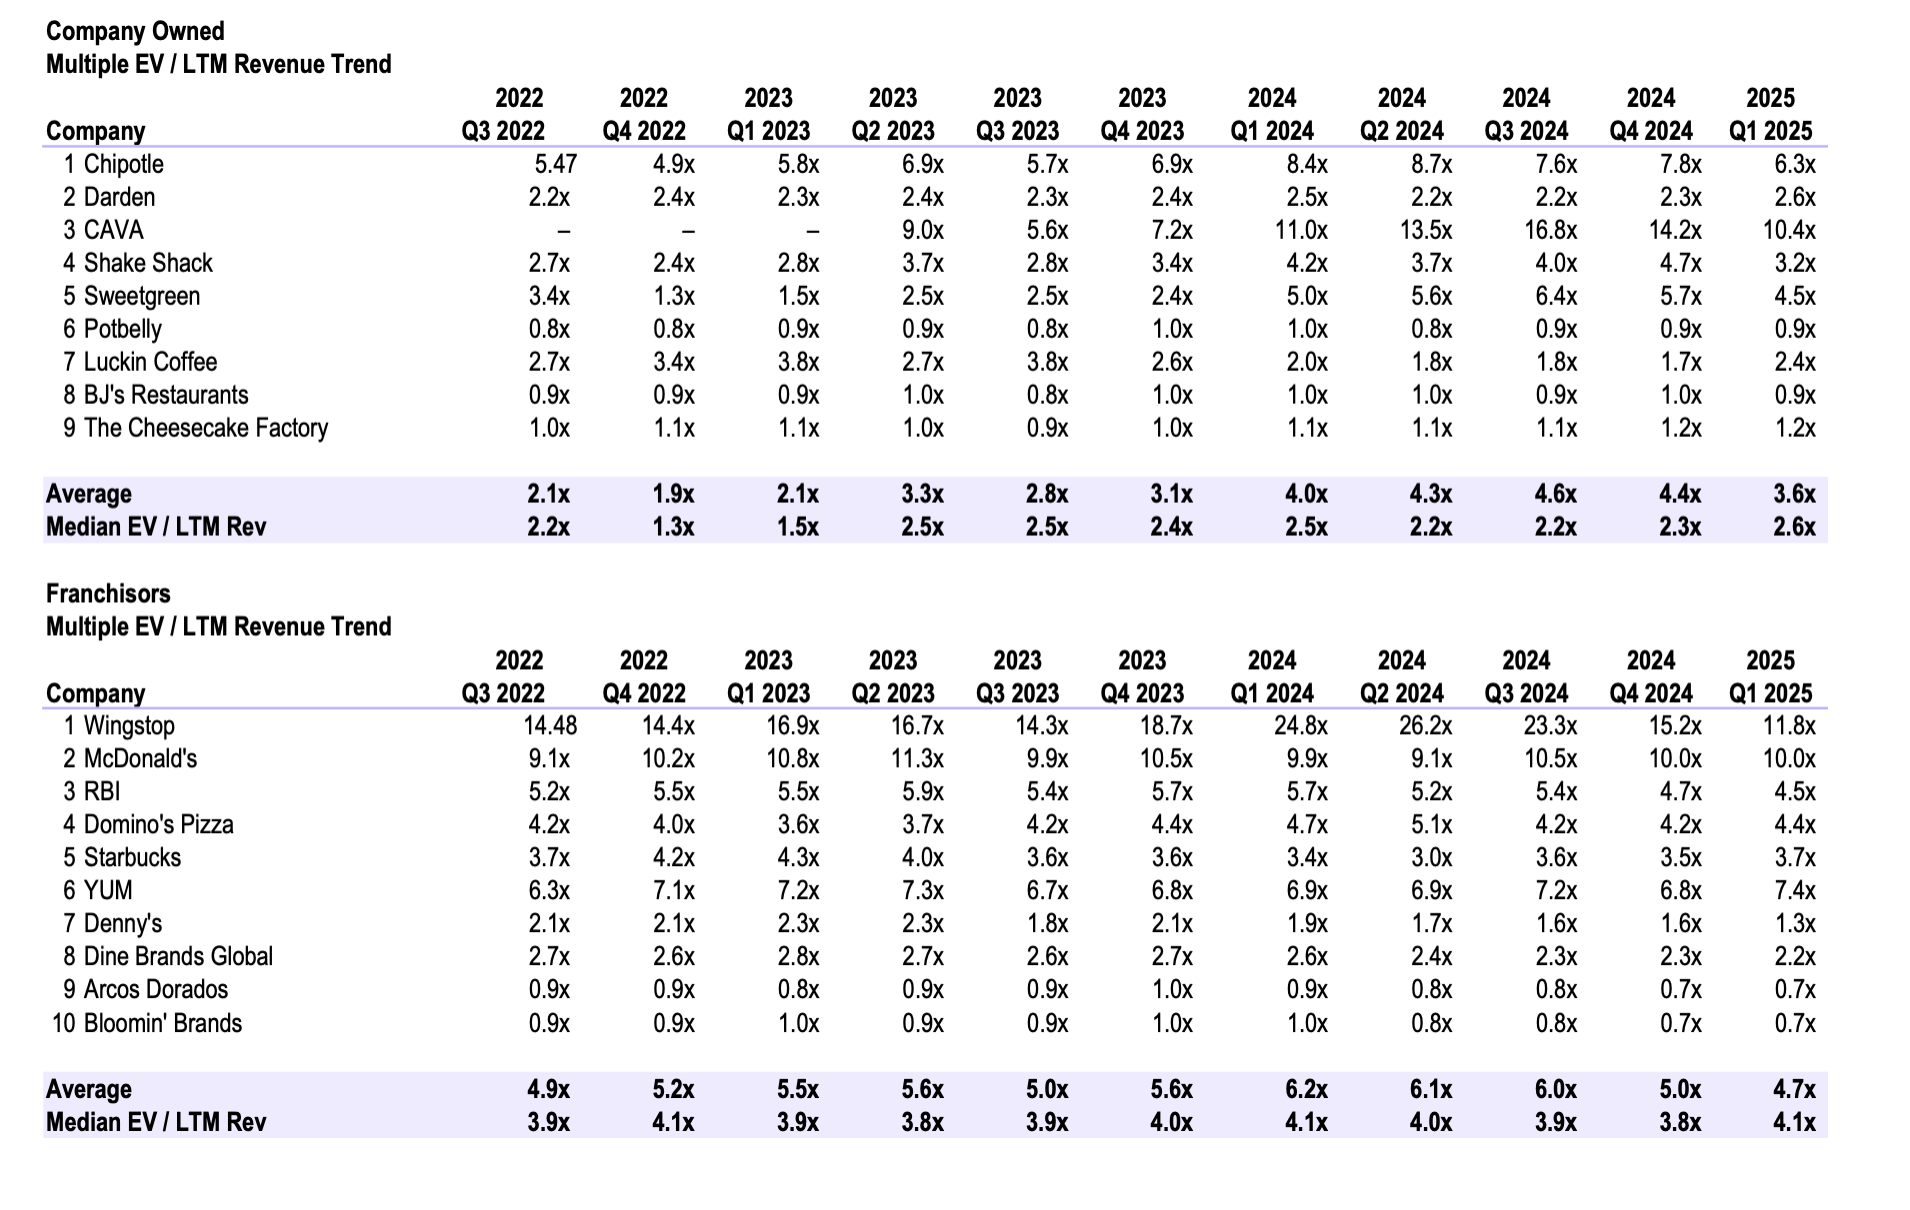
Revenue Multiple Trends
Restaurant businesses are generally valued on multiples of their revenue or EBITDA, depending on their capital structure, growth potential, and franchise model. For example, a McDonald’s franchise has a higher revenue multiple than a company-owned restaurant chain like Shake Shack.
Here are some of the factors that affect restaurant valuation multiples:
- Capital structure: Businesses with less debt and more equity tend to have higher valuation multiples.
- Growth potential: Businesses with high growth potential tend to have higher valuation multiples.
- Franchise model: Franchise businesses tend to have higher valuation multiples than company-owned
businesses.
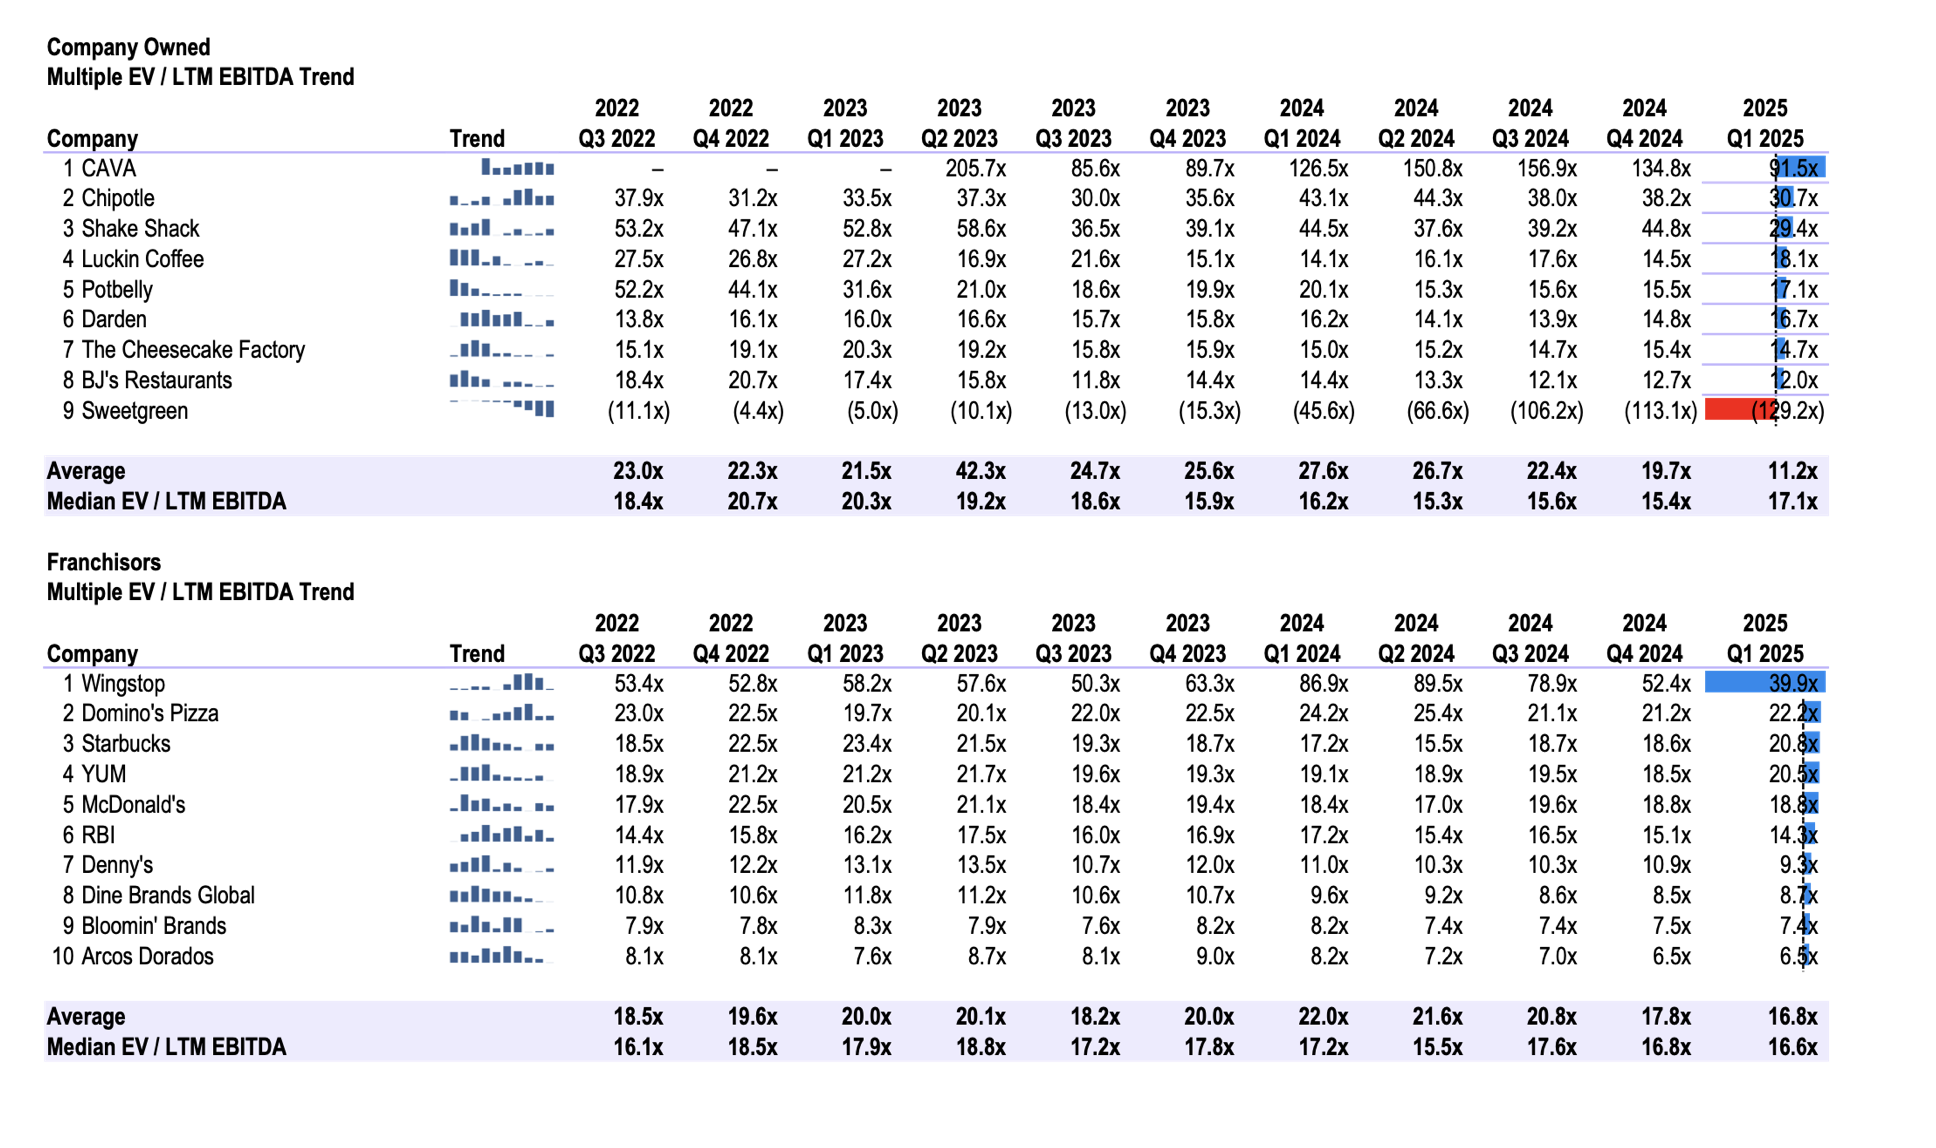
EBITDA Multiple Trends
Sources
TIKR
Bloomberg
Company 10-Q and 10-K Filings
Restaurant Business
Bureau of Labor Statistics (BLS) [bls.gov] U.S. Bureau of Economic Analysis (BEA) [bea.gov] U.S. Department of Agriculture (USDA) Economic Research Service [ers.usda.gov] Federal Reserve Economic Data (FRED) [fred.stlouisfed.org] National Restaurant Association [restaurant.org] International Monetary Fund (IMF) [imf.org]
Disclaimer
The information provided is believed to be from reliable sources, but no liability is accepted for any inaccuracies. This is for information purposes and should not be construed as an investment recommendation. Past performance is no guarantee of future performance.
This post and the information presented are intended for informational purposes only. The views expressed herein are the author’s alone and do not constitute an offer to sell, or a recommendation to purchase, or a solicitation of an offer to buy, any security, nor a recommendation for any investment product or service. While certain information contained herein has been obtained from sources believed to be reliable, neither the author nor any of his or their affiliates have independently verified this information, and its accuracy and completeness cannot be guaranteed. Accordingly, no representation or warranty, express or implied, is made as to, and no reliance should be placed on the fairness, accuracy, timeliness, or completeness of this information. The author and all employers and their affiliated people assume no liability for this information and no obligation to update the information or analysis contained herein in the future.